The muon lifetime experiment
PART V: Four different versions of the experiment
THIRD EXPERIMENT - Runs 10 to 11
TAC to MCA (i.e. full NIM)
Idem previous version, this time with TAC output to multi-channel analyzer(MCA) direct input. This is the best quality instrumentation available in the neighbourhood. One question still remains: is a constant-fraction discriminator (CFD) necessary? The question is: do we have different risetimes for muons and electrons?.
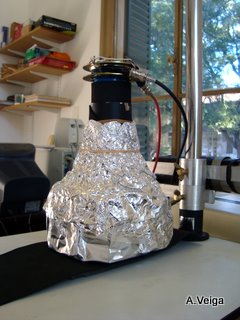
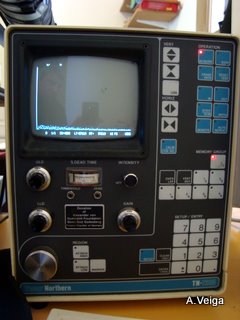
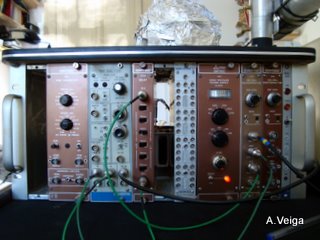
Common to all experiments: BIG scintilator, HV=2000V, Ortect 436 discriminator, Canberra 2143 time analyzer and TN-7200 MCA.
Variables: TAC range and discriminator level.
Experimental layout
Run 10
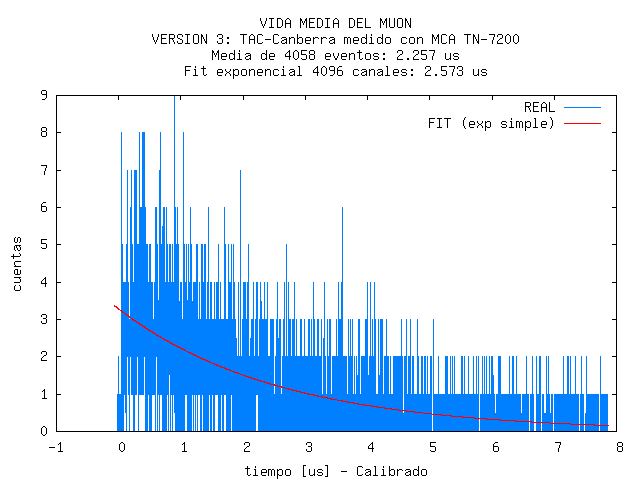
TAC range 10 μs. Discriminator level = 4.5, output rate (START) ~10 Hz. Reduced probability of eventual stops (see calculations).
4000 stoped and detected muons y ~4 days (416082 seconds). Muon stop rate ~1 every 100 seconds. Measured τμ = 2.37 μs
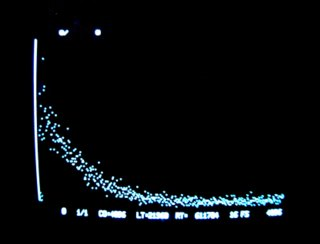
Full histogram (4096 channels)
Reduced histogram (128 channels)
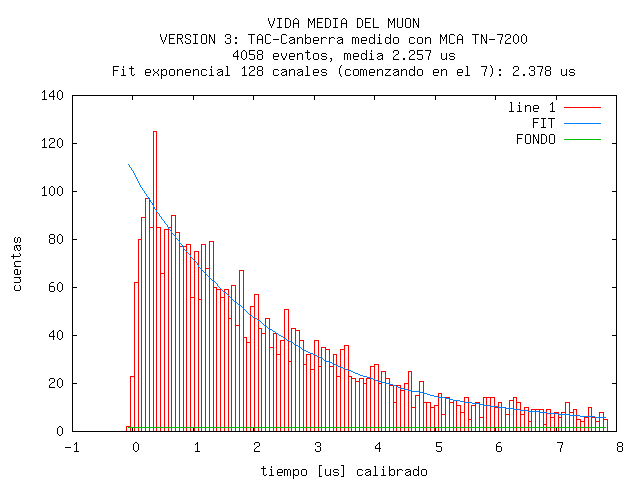
Mean value approximates lifetime very well because there is a very small probability of eventual STOP (almost no background). But it is not exact because the tail of the exponential was not recorded.
In order to record at least 5 &tau and fit better, the TAC range should be 20 μs. Repeat experiment.
Run 11
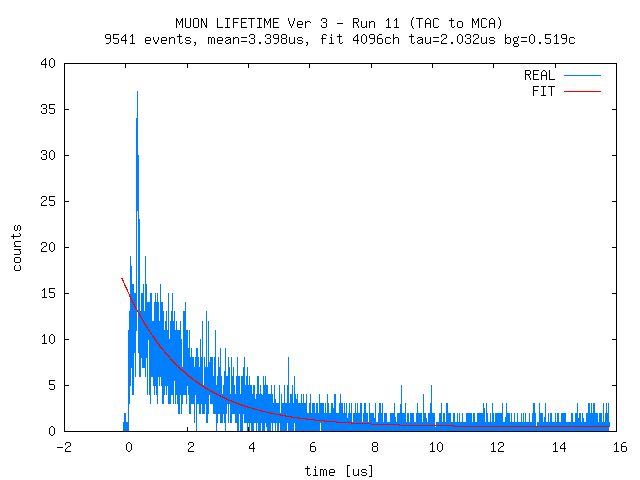
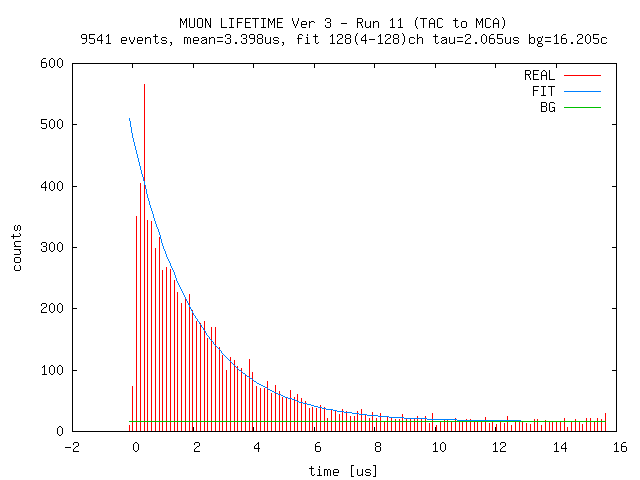
TAC range 20 μs.
Discriminator level = 2.8 -> output rate (START) fluctuating between 25 and 10 Hz along the days (depends on light, climate, preassure?).
| Tue Jul 14 | sunny | 25 Hz | |
| Wed Jul 15 | sunny | 25 Hz | |
| Thu Jul 16 | clouded | 12 Hz | |
| Fri Jul 17 | .. | .. | |
| Mon Jul 20 | partially clouded | 18 Hz | |
| Tue Jul 21 | rainy | 10 Hz | 9 C |
| Wed Jul 22 | rainy, very cold | 0 C | |
| Thu Jul 23 | sunny, very cold | 13 Hz | 2 C |
| Fri Jul 24 | sunny, cold | 14 Hz | 7 C |
Probability of eventual STOP approximately equal to probability of valid STOP when 25 Hz (see calculations). This means that there should be more background in the histogram, but I can't tell how much as rate fluctuates. Rising a bit the probability of eventual STOPs provides a better background reference and allows recording with lower discriminator level, reducing the true event rejecting. Decay rate should improve.
Run 11 Full histogram
Run 11 Reduced histogram
Fit result:
Nice result: this time τμ < 2.2 μs (see muon capture).
Mean value does not reflect lifetime because there is a significant background. While muons have a mean life of 2.2 μs, background in the 16 μs range has an 8 μs mean. After fitting, background rate can be calculated with this data.
OCTAVE FIT (see scripts)
octave:1> mu11
eventos:9541 fit:2.03 media:3.40
octave:2> NN=128;N1=4;N2=128;mu11_fix
fit = 2.0655
fondo = 16.205
residuos = 0.97600
media_calc = 3.1307
media = 3.3978
octave:3> media_calc=((fondo*NN)*8.0+(8502-(fondo*NN))*fit)/eventos
media_calc = 3.1307
octave:4> NN*fondo
ans = 2074.2
octave:5> eventos-NN*fondo
ans = 7466.8
From 9541 events, NN*fondo = 2074.2 are eventuals -> 7466.8 muon decays.
Real time RT=866000 s.
Decay rate = 1 muon / 116 s
Eventuals = 1 / 417 s
Notes
Like in the previous experiment, a disadvantage of this method is that absolute time information of the events is not recorded, so rate vs. time calculations are not available.
